A straight-line graph is a central concept in algebra and geometry, often acting as the stepping stone to deeper mathematical understanding. A straight line can be represented by various equations, but fundamentally, it maps out a linear relationship between two variables – typically x and y.
One of the simplest forms of these equations is for horizontal and vertical lines. Every horizontal line is represented by the equation y = a, where a is a fixed number. This means that no matter what x-value you choose, y remains constant along the line. Imagine a line running parallel to the x-axis; it never climbs or dips – it’s always flat at y = a, whether a is 3, -2, or even 0. The same logic applies to vertical lines, which are described by x = b. No matter what y-value is, x is constant on this line, creating a perfect up-and-down path parallel to the y-axis at x = b.
RESOURCES
-
- Straight Line Graphs | Maths Charts | Laminated Gloss Paper measuring 594 mm x 850 mm (A1) | Math Charts for the Classroom | Education Posters by Daydream Education (https://amzn.to/3WuNuvJ)
These are affiliate links. If you click a link and buy the product, thn the blogger gets a percentage of the sale or some other type of compensation. Prices are not different if you use these affiliate links. You will not pay more by clicking through to a link.
GRADIENTS
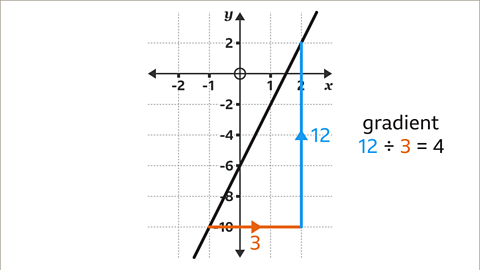
The gradient of a straight line is essential for understanding its steepness. Calculating the gradient involves taking two points on the line and dividing the difference in their y-values by the difference in their x-values. This gives you a measure of how much y changes for a unit change in x. So, gradient = (y2 – y1) / (x2 – x1). A line that slopes upwards from left to right has a positive gradient, while a line sloping downwards has a negative gradient.
EQUATIONS OF STRAIGHT-LINE GRAPHS
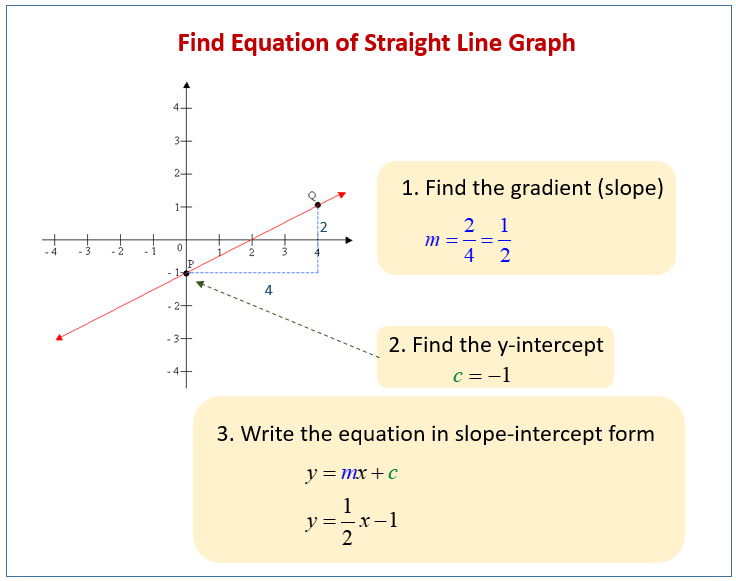
The general equation for any straight line is y = mx + c. Here, m represents the line’s gradient or slope, and c is the y-intercept, the point where the line crosses the y-axis. For example, if you have the equation y = 3x + 5, the number 3 is the gradient, telling you how steep the line is. Meanwhile, 5 is the y-intercept, indicating that the line passes through the y-axis at y = 5.
Understanding these components is crucial for graph interpretation. The gradient m shows how much y changes for each unit increase in x. If the gradient is positive, the line slopes upward; if negative, it slopes downward. The y-intercept c provides an anchor point, helping to plot the line accurately on a graph.
PARALLEL AND PERPENDICULAR LINES
Parallel lines share the same gradient. This means if you have one line with a gradient of 2, any line parallel to it will also have a gradient of 2, no matter where it crosses the y-axis. On the other hand, perpendicular lines have gradients that are negative reciprocals of each other. If line A has a gradient of 3, any line perpendicular to it will have a gradient of -⅓. Together, their gradients multiply to -1, a neat mathematical property.

LINE SEGMENTS
When dealing with line segments, the midpoint can be especially useful. The midpoint of a line segment is simply the average of the x-coordinates and the y-coordinates of the endpoints. If you have a line segment between points (x1, y1) and (x2, y2), the midpoint M can be found by using the following formula: 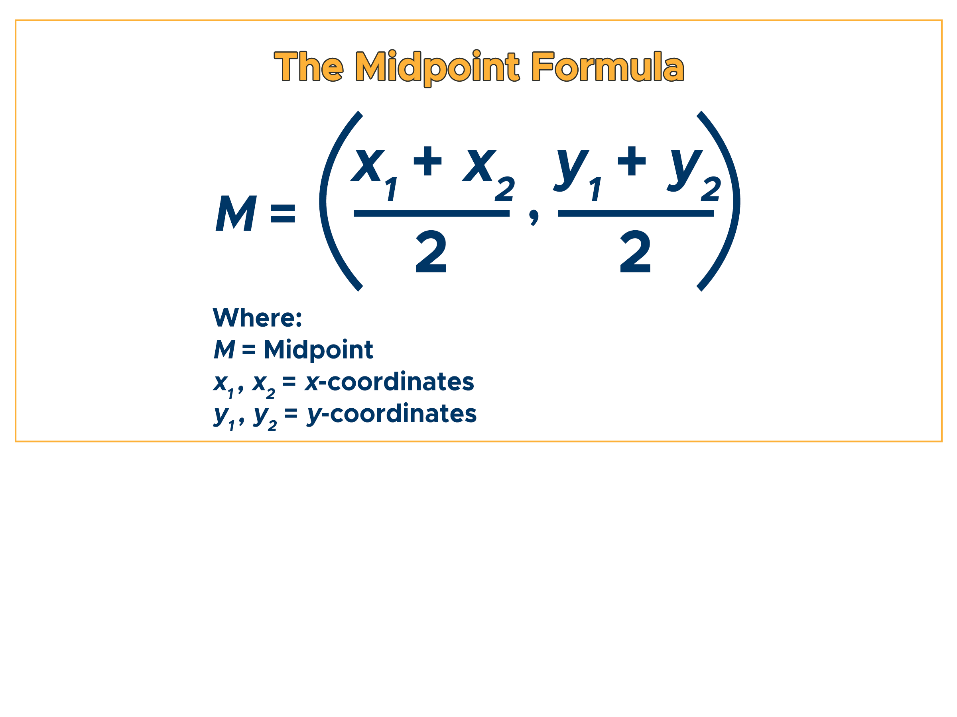 This is practical for locating the center of a line segment, whether you’re graphing or solving geometrical problems.
CONCLUSION
Real-world applications of these concepts are vast. In economics, straight-line graphs help illustrate simple relationships between variables, such as cost versus quantity. In physics, they can describe linear motion or electrical resistance in circuits. The simplicity and versatility of straight-line graphs make them a fundamental tool in various fields.
Grasping these key concepts aids in deeper comprehension of more complex mathematical topics. These foundations allow for precise graphing and solving of linear equations, proving their indispensable value in both educational and practical real-world applications.


No responses yet