RESOURCES
GCSE Maths – Types of Graphs Information Poster – Teach & Learn – Display, Decoration, Bulletin Board Poster – Paper Laminated – A2 42 x 59.4 cm (https://amzn.to/4fhFsgq)
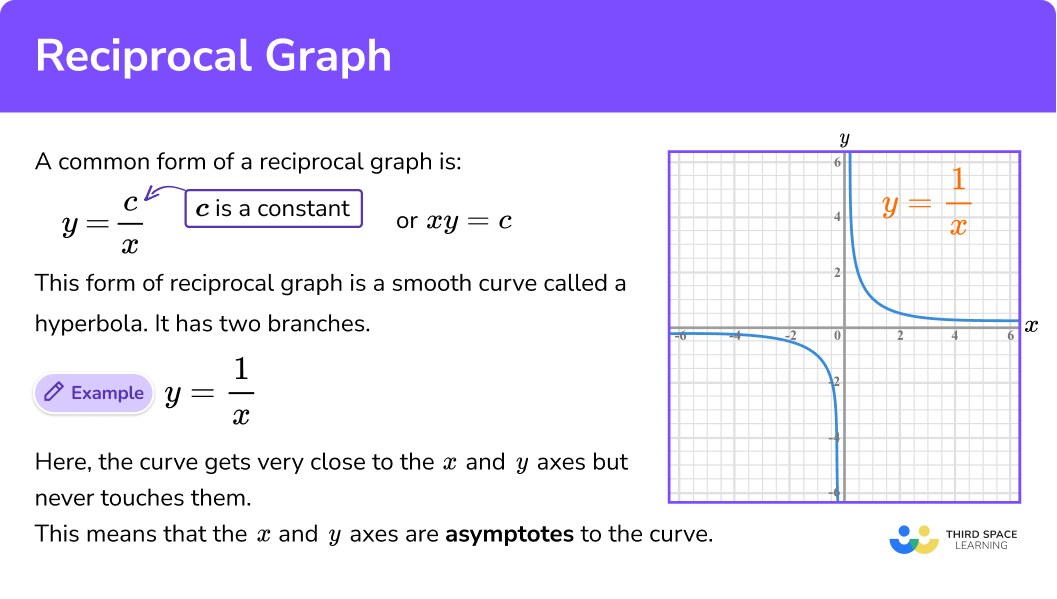
RECIPROCAL GRAPHS
Reciprocal functions involve a term 1/f(x), where f(x) is a function of x. These functions are undefined when the denominator is zero, which means the graph won’t have values at these points. An important feature of reciprocal graphs is the presence of asymptotes. An asymptote is a line that the graph approaches but never actually touches. For instance, the graph of y = 1/x has asymptotes at x = 0 and y = 0.
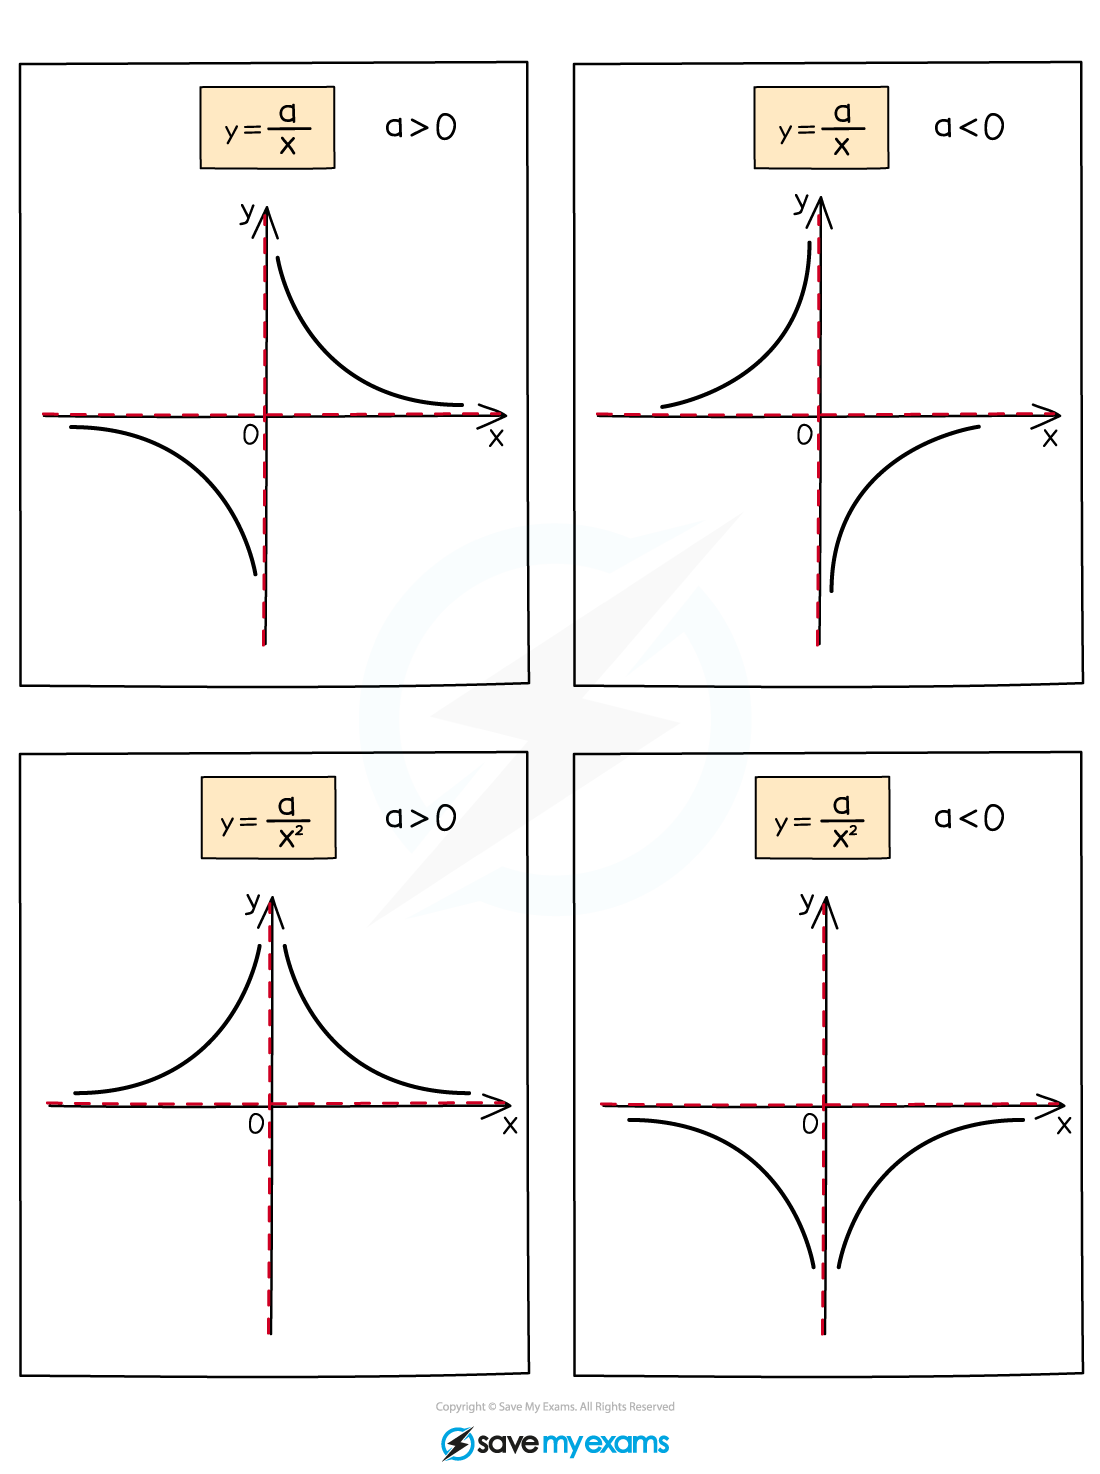
MORE RECIPROCAL GRAPHS
If we take a look at more complex graphs, such as y = 1/x2, we notice some differences. Since squared numbers are always positive, y =1/x2 only takes on positive values. This means that its graph looks a bit different from that of y = 1/x, but it still has the same asymptotes at x = 0 and y = 0.
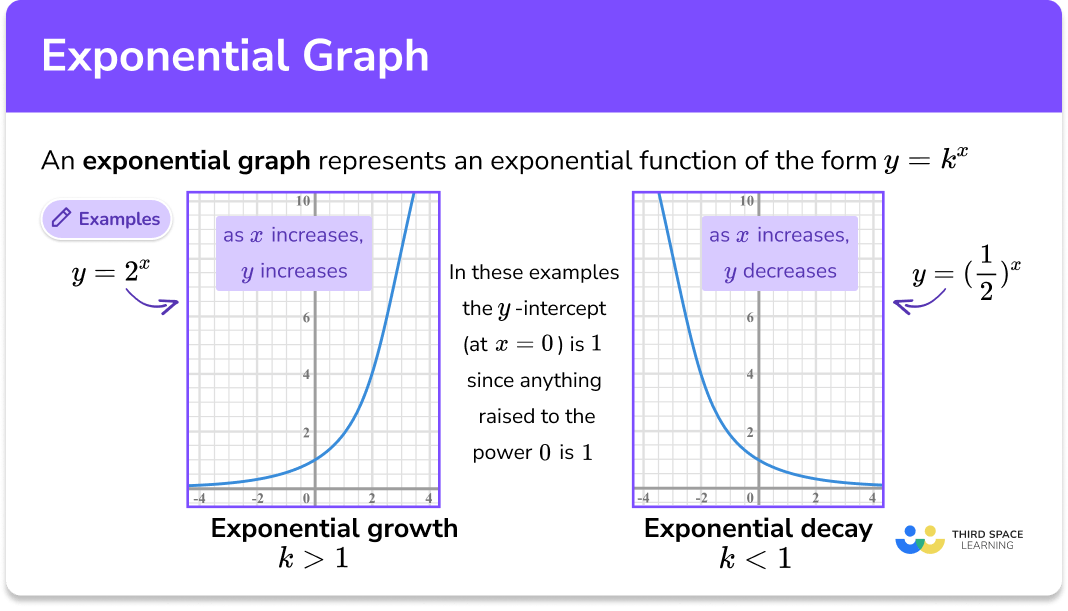
EXPONENTIAL GRAPHS
Exponential functions, on the other hand, have the form y = ax, where a is a constant greater than zero. The behavior of exponential graphs varies depending on the value of a. When a is greater than 1, as x gets larger, ax increases very quickly. However, as x becomes more negative, ax approaches but never quite reaches zero. This is why the x-axis acts as an asymptote for exponential graphs.
When a is less than 1, the behavior flips. As x increases, ax decreases, still approaching zero but never actually hitting it. On the other hand, as x becomes more negative, ax gets much larger. Understanding this behavior is crucial since exponential functions are often used to model real-world phenomena such as population growth or radioactive decay.
CONCLUSION
Grasping the differences between reciprocal and exponential graphs is essential for various applications, from solving mathematical problems to interpreting scientific data. Both types of graphs feature asymptotic behavior but exhibit it in unique ways. Knowing how these graphs behave allows us to predict and interpret patterns and trends more effectively.


No responses yet