Compound measures bring together two or more individual measurements into a single, unified measure. These are very useful in making sense of everyday phenomena and technical fields. To give you a better understanding, let’s explore some common examples like speed, density, and pressure.
Speed is a classic example. You calculate it by dividing distance by time. If you need to determine distance or time, you can easily rearrange the formula. For instance, Distance equals Speed multiplied by Time, and Time equals Distance divided by Speed. This formula acts like a bridge connecting how far something travels and how long it takes.
Density is just as fascinating. It’s defined as mass per unit volume. Picture trying to understand how heavy or light an object is relative to its size. The formula here is Density equals Mass divided by Volume. Rearranging the formula, Volume can be found by dividing Mass by Density, and Mass by multiplying Density and Volume. These equations allow us to solve various real-world problems involving liquids, solids, and gases.
Pressure, another compound measure, quantifies the force exerted per unit area. The formulas interlinking pressure, force, and area are pretty straightforward. Pressure equals Force divided by Area. Area can be calculated by dividing Force by Pressure, and Force by multiplying Pressure and Area. In engineering and science, these formulas play a crucial role in designing structures, understanding weather patterns, and even in medical applications.
RESOURCES
This is an affiliate link. If you click the link and buy the product, then the blogger gets a percentage of the sale or some other type of compensation. Prices are not different if you use these affiliate links. You will not pay more by clicking through to the link.
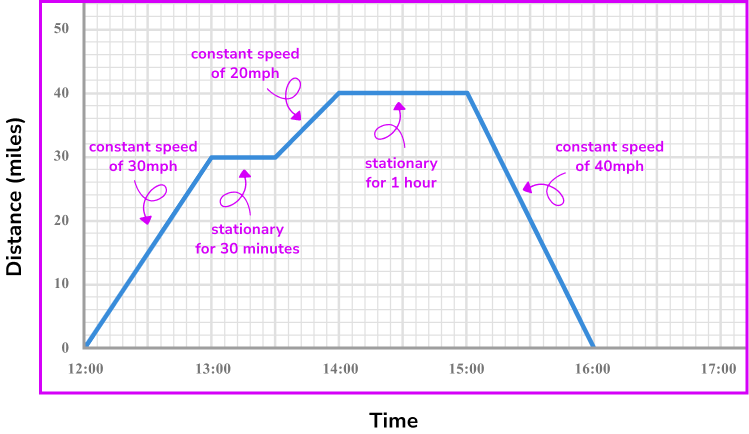
DISTANCE-TIME GRAPHS
Graphs are powerful tools for visualizing how different measures change over time. Two types of graphs commonly used are distance-time graphs and velocity-time graphs. Each provides unique insights into motion and speed, crucial for fields like physics, engineering, and even everyday activities like driving.
A distance-time graph depicts how far an object travels within a specific period. The key is to look at the gradient, or slope, of the line. A steeper slope indicates a higher speed, while a straight line signifies constant speed. If the line is horizontal, the object isn’t moving. Curved lines reveal changes in speed—either acceleration or deceleration—making these graphs invaluable for analyzing movement patterns.
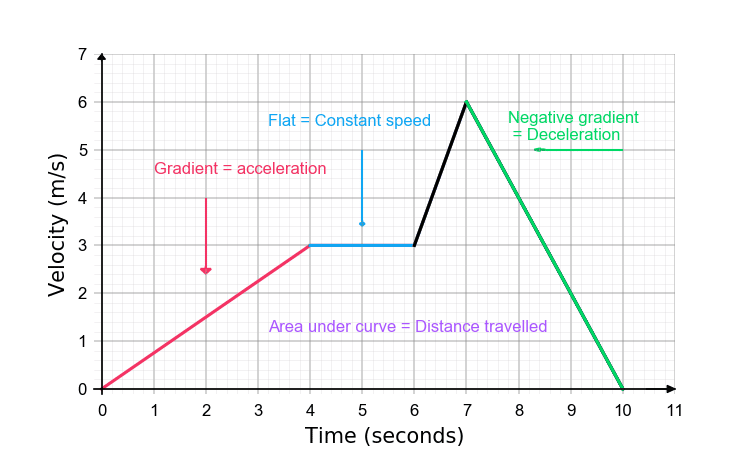
VELOCITY-TIME GRAPHS
Velocity-time graphs take this a step further by showing the speed and direction of an object. Unlike distance-time graphs, these show how fast something is moving and whether it’s speeding up or slowing down. If you spot a steep gradient, it means rapid acceleration or deceleration. A straight line reveals constant acceleration, while a horizontal line shows constant velocity.
One of the coolest aspects of velocity-time graphs is that the area under the graph represents the distance traveled. This makes it easier to calculate distances, even when speeds vary. By understanding these graphs, you can gain deeper insights into an object’s journey, translating complex data into understandable visuals.
CONCLUSION
Whether you’re dealing with speed, density, or pressure, understanding and using these formulas can simplify a lot of everyday tasks and technical challenges. They’re like tools that help you see how different quantities relate to one another, making problem-solving more intuitive.
Distance-time and velocity-time graphs aren’t limited to classrooms and textbooks. They have practical applications everywhere, from planning travel routes to optimizing mechanical processes. Mastering these graphs can offer a clearer understanding of how various factors influence movement and help you make more informed decisions.


No responses yet